The Langmuir Optimization Program
| Alfisol, Item 003: | LMMpro, version 2.0 The Langmuir Optimization Program |
|
|
|
The correlation coefficient η2 coincides with r2 in the linear regression setup. The eta-square term is used here for the correlation coefficient value of the untransformed data.
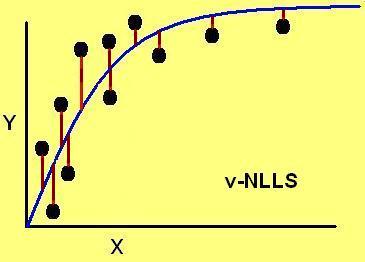
The η2 assumes that a vertical minimum for the error terms corresponds to a better curve fit of the data collected. It is defined as:
|
|
A perfect fit by a curve will have η2 = 1.00, whereas a poor fit by a curve will have a low value. If η2 = 0, then the predicted curve is no better than a simple average of the data collected. With all regressions, η2 < 1, always.
This is not easy to do by hand. Computers are needed to perform these calculations easily and quickly.