The Langmuir Optimization Program
| Alfisol, Item 003: | LMMpro, version 2.0 The Langmuir Optimization Program |
|
|
Data Error:
This type of error can exist for various reasons. The equipment may have been incorrrectly calibrated,
or it may have had a slow drift in its readings. For this reason, make sure that the equipment is properly calibrated, and
recheck the calibration as often as possible, such as at the start, middle and end of a long set of
samples analyzed. Another common source of data error is a result of human error, such as incorrectly
recording the results.
Accordingly, it is good practice to proof read all of your data entries.
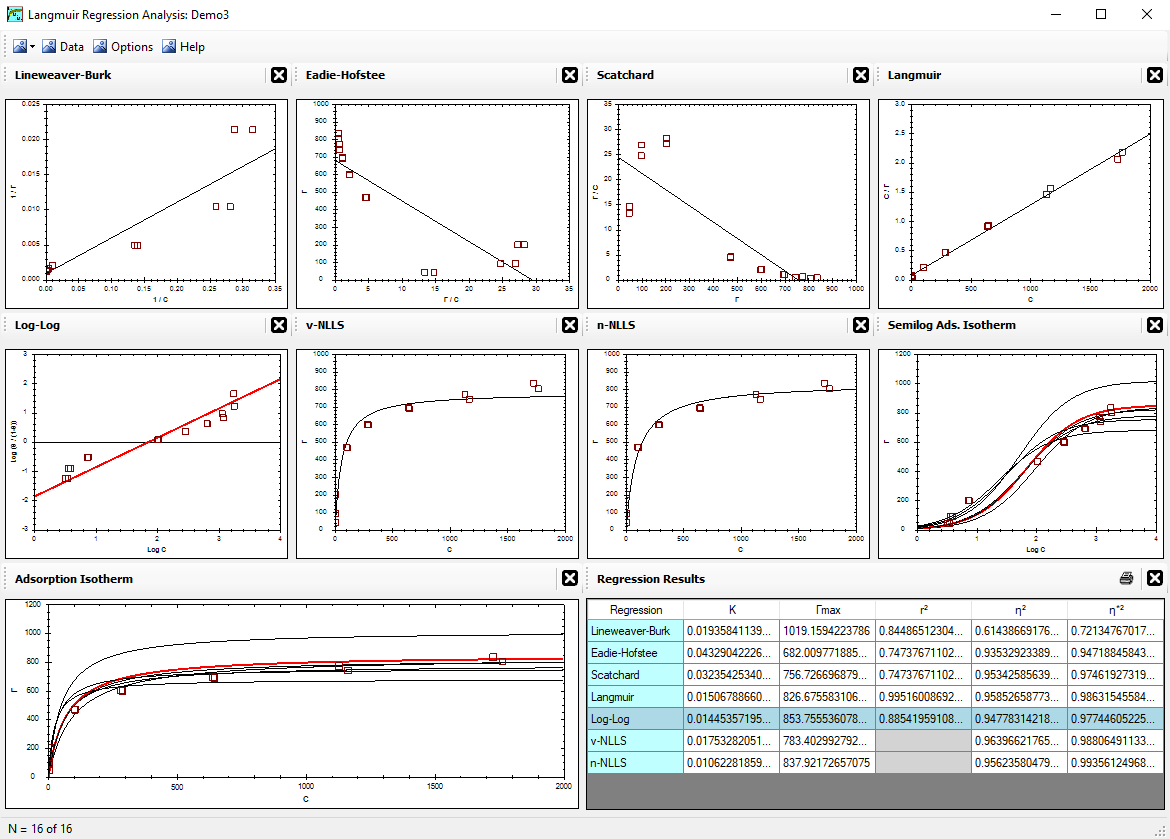
Data error is often relatively easy to identify. Various statistical tools are available that specifically address this topic, such as the Student t-test. It is strongly recommended that all your experiments be repeated often. The more repetitions made, the better. Repetitions will hopefully result in an average value that is close to the correct answer. The higher the number of data points collected, the more reliable the analysis of the data. This will be always true with all the linear and nonlinear regression analyses of your data.
Regression techniques on a small group of data are strongly impacted by any error present. This is particularly obvious with some linear regressions, such as the Lineweaver-Burk linear regression. Accordingly, do try to identify outliers in your data by looking at the reproducibility of the data and by looking at the general shape or pattern of all your data. Typically, however, reproducing the data will result in an average value for your data in each protion of the graph, and this is nearly always sufficient for a successful regression analysis.
Theory Error:
Much attention is generally paid to data error and human error, but theory error is often difficult to recognize.
Always check for data error first because it is easier to evaluate. But do remember to check for theory error second.
With LMMpro, the theory is described by either the Langmuir equation or the Michaelis-Menten equation.
If the data can be predicted by the equation, then we presume that the theory or mechanism that the equation is
based on is also correct for the data set in question.
When theory error occurs, the shape of the
adsorption isotherm or the saturation curve will probably be very difficult to optimize. A different
answer with each regression technique used is a strong indicator of an error present, and if you've already
addressed data error as not a problem, then you are probably observing a theory error.
Note also that the theory error can be very small and subtle.
Examples of theory errors are:
1. The K or KM value is not constant.
2. The Γmax or Vmax value is not constant.
The values at low concentrations may be different from those values at high concentrations.
Regression Bias:
Generally, discussions about regression bias focus on the impact of data error on the regression results.
For example, if the data are too high at low concentrations, then some regression techniques will try to
predict these high data points much more aggressively than the other data plotted in your graph.
Unfortunately, you do not really know if the high data at low concentrations
are correct or if they are nothing more than a few bad data points.
To be sure, nearly all the regression techniques have some sensitivity to data error. Do not forget, however,
that you might also be observing a regression bias that is sensitive to theory error. It is very difficult to
differentiate between these two types of error.
A recommended technique is to first evaluate data error
via the reproducibility of the data. Minimize and "eliminate" data error before you address the possibility of
theory error.
In summary, if your analysis is sensitive to the type of regression used, then you have some error present. The error is either data error, theory error, or both.
<Reference = CTT-15>