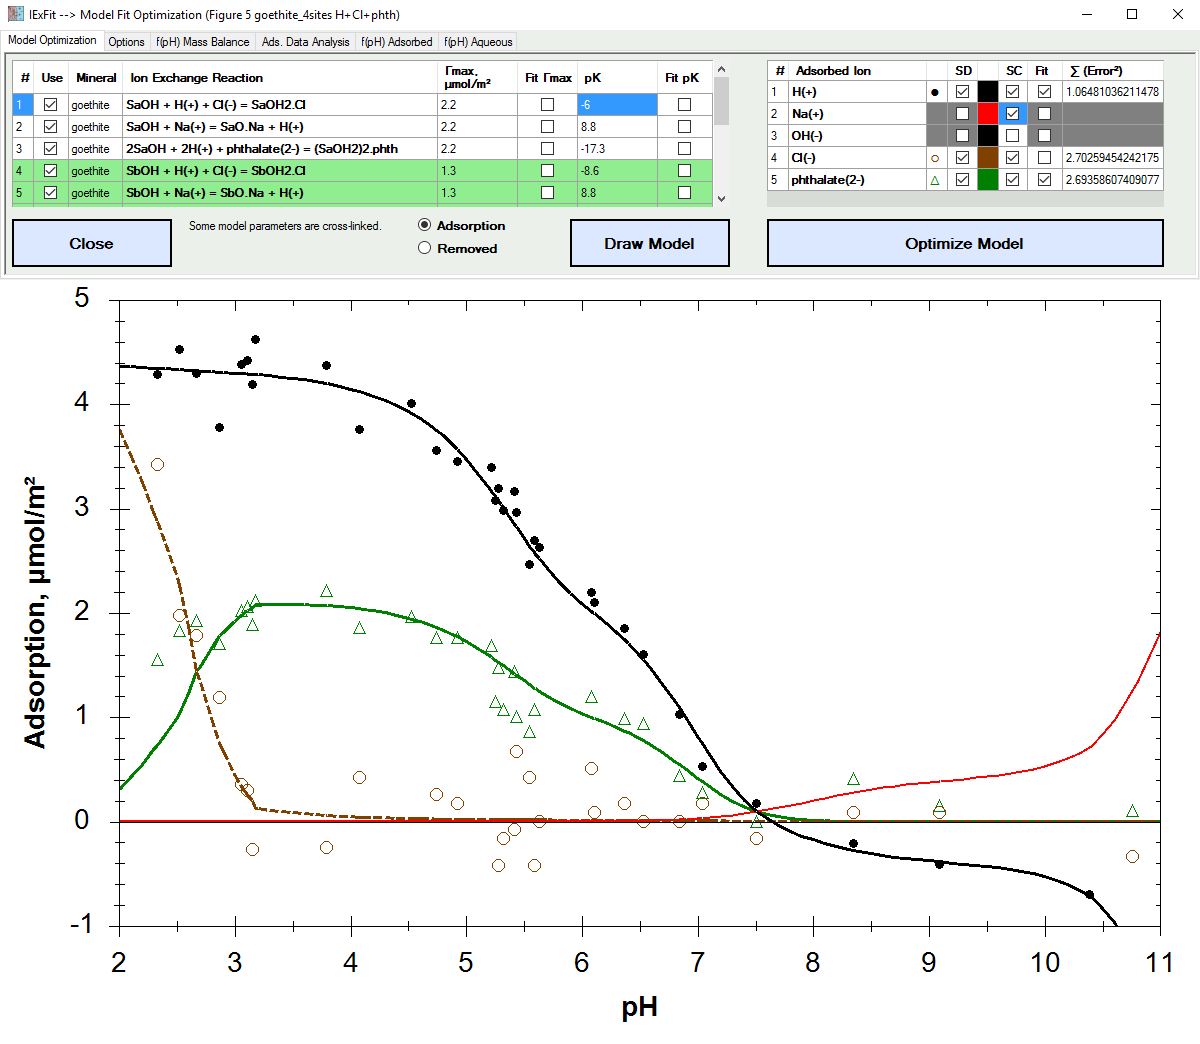
Fit adsorption data based on ion exchange reaction models.
Display solid & liquid & gas phase speciation diagrams as a funciton of pH & redox conditions.

| Alfisol, Item 007: | IExFit, version 3.4 Fit adsorption data based on ion exchange reaction models. Display solid & liquid & gas phase speciation diagrams as a funciton of pH & redox conditions. |
|
Software Overview |
|
|
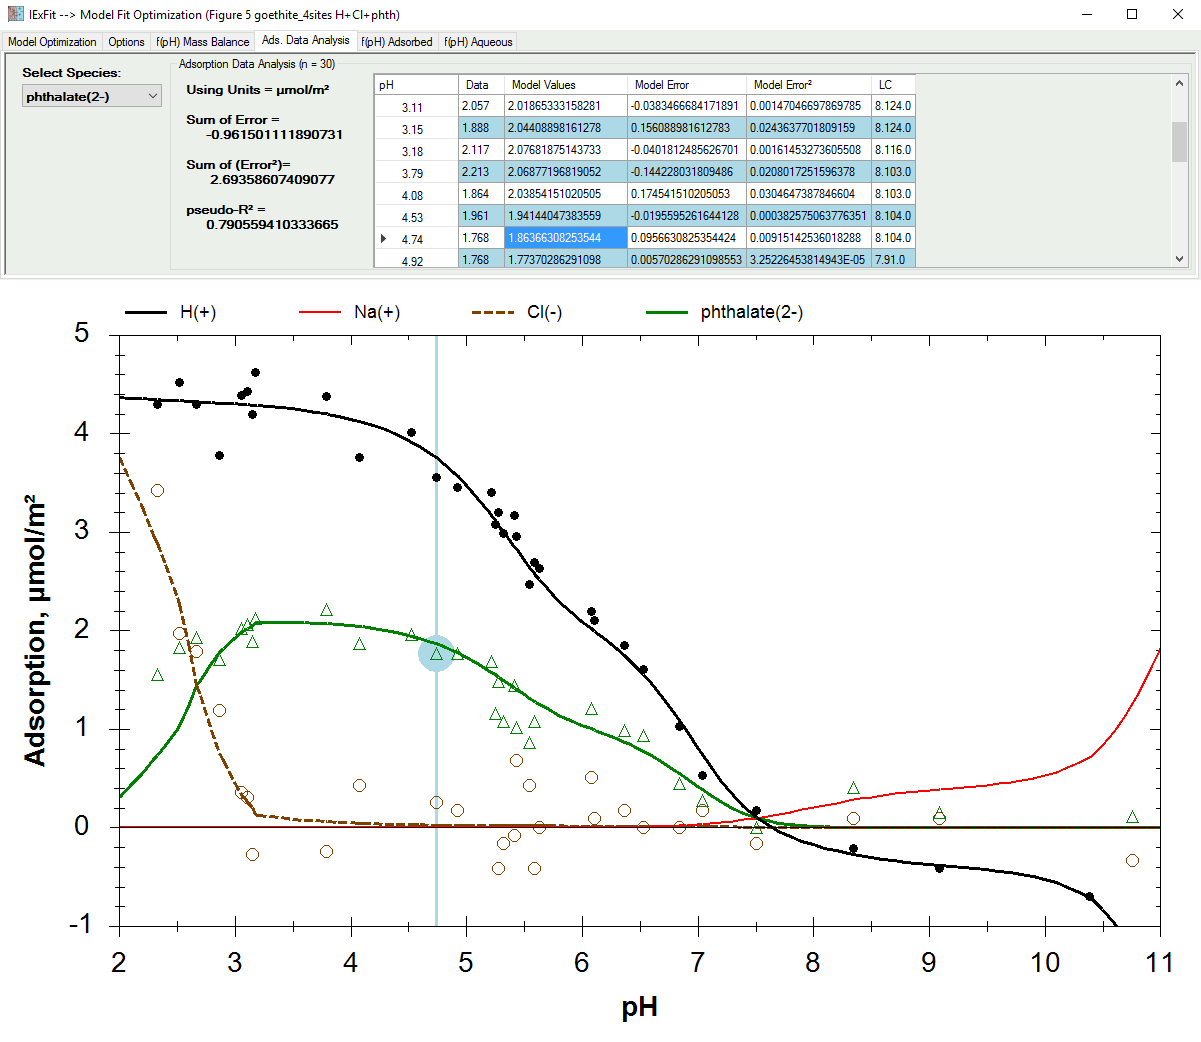
Click on the "Ads. Data Analysis" tab to view the goodness-of-fit of each data point in the graph with the model-generated prediction. The pseudo-R2 value (Efron's Coefficient of Determination) of each of the curves generated are also given. This tab is not shown if there was no model entered in the Control Center.
In the example below, the proton adsorption data were collected using the Backtitration Technique (Schulthess & Sparks, Soil Sci. Soc. Am. J., 1986).