Fit adsorption data based on ion exchange reaction models.
Display solid & liquid & gas phase speciation diagrams as a funciton of pH & redox conditions.

| Alfisol, Item 007: | IExFit, version 3.4 Fit adsorption data based on ion exchange reaction models. Display solid & liquid & gas phase speciation diagrams as a funciton of pH & redox conditions. |
|
Software Overview |
|
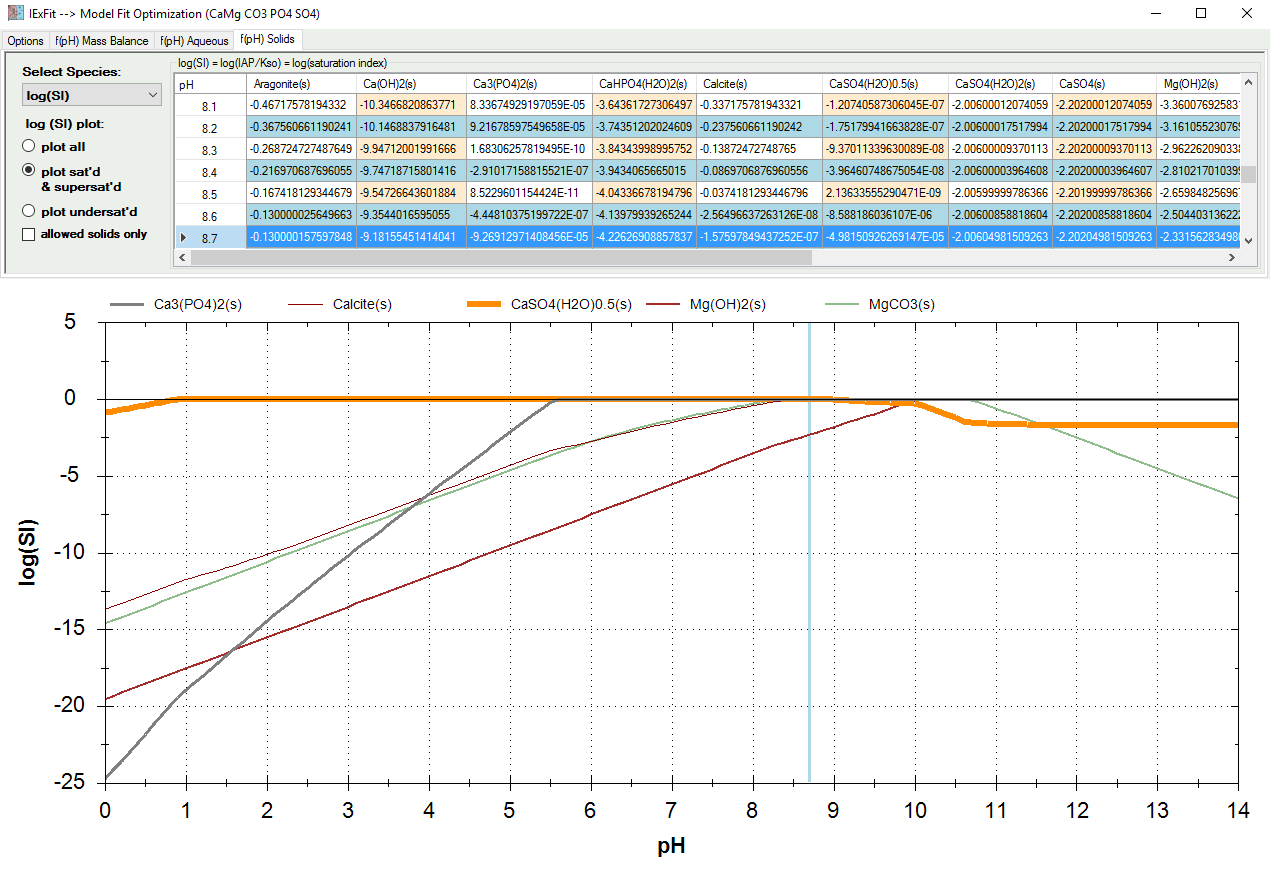
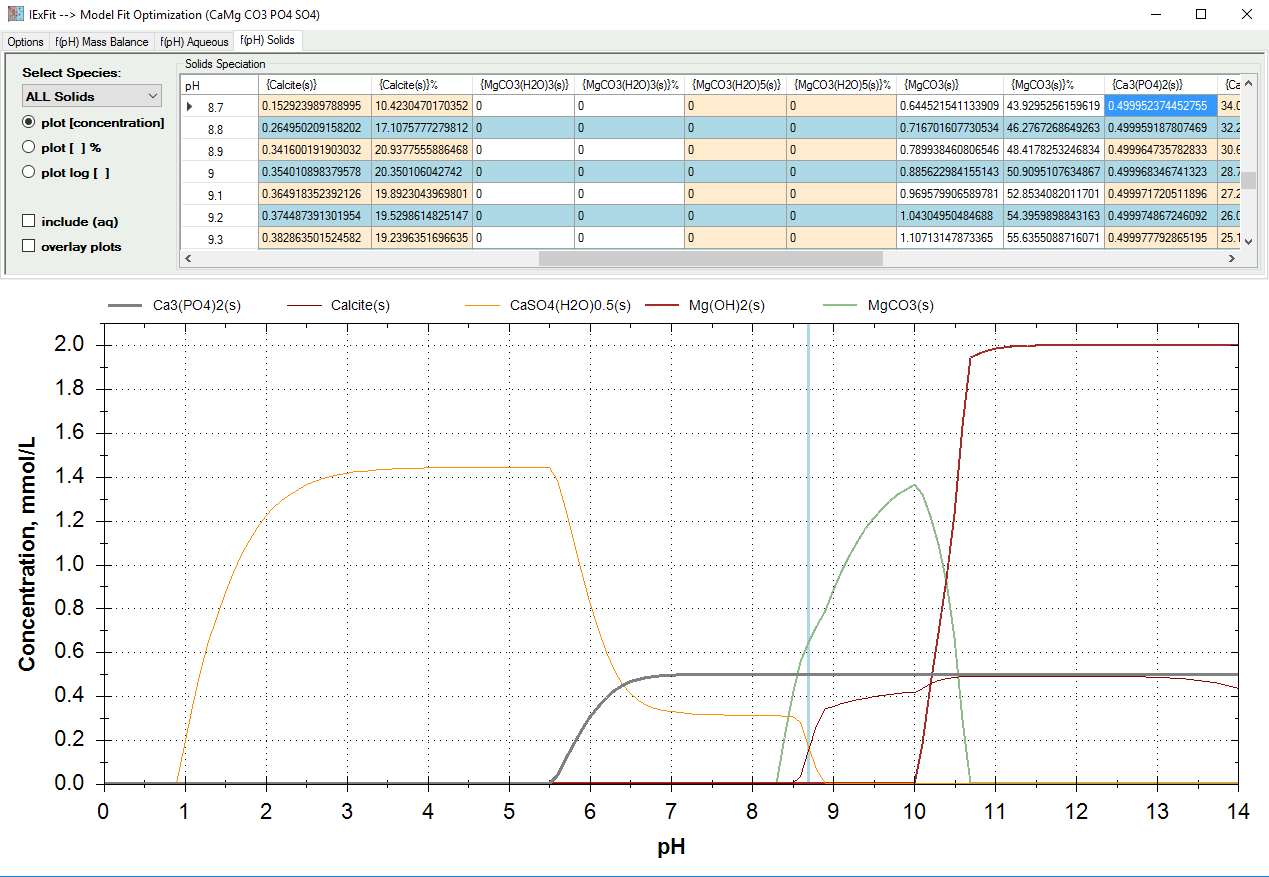
Click on the "f(pH) Solids" tab to view the distribution of each of the solids formed as a function of pH.
In the example below, we see the log(SI) values (top image) and concentration values (bottom image) for an exercise involving Mg(2+) and Ca(2+) ions.
Note, log(SI) = log (saturation index).